从零开始创建简单的Linear Regression

原贴出自 Abhishek Dhule 在 Kaggle上的 “Implementing Simple Linear Regression from scratch”

Import library

1
2
3
4
5
import numpy as np
import seaborn as sns
import matplotlib.pyplot as plt

%matplotlib inline

Generate test data

1
2
3
4
5
6
7
8
np.random.seed(1)
x = np.random.randn(2000,1)
w = np.random.randn()
b = np.random.randn()
y = x * w + b + (np.random.randn(2000,1) * 0.08) # 引入noise,生成output data set
print('w ', w, 'b ', b)

# w  0.4895166181417871 b  0.2387958575229506

Plot generated data

1
2
3
4
5
6
7
plt.figure(figsize=(12,8))
plt.title('Generated Test Data')
plt.xlabel('Input(x)')
plt.ylabel('Output(y)')
sns.scatterplot(x=x[:,0],y=y[:,0]) #取所有x,y
plt.grid(True)
plt.show()

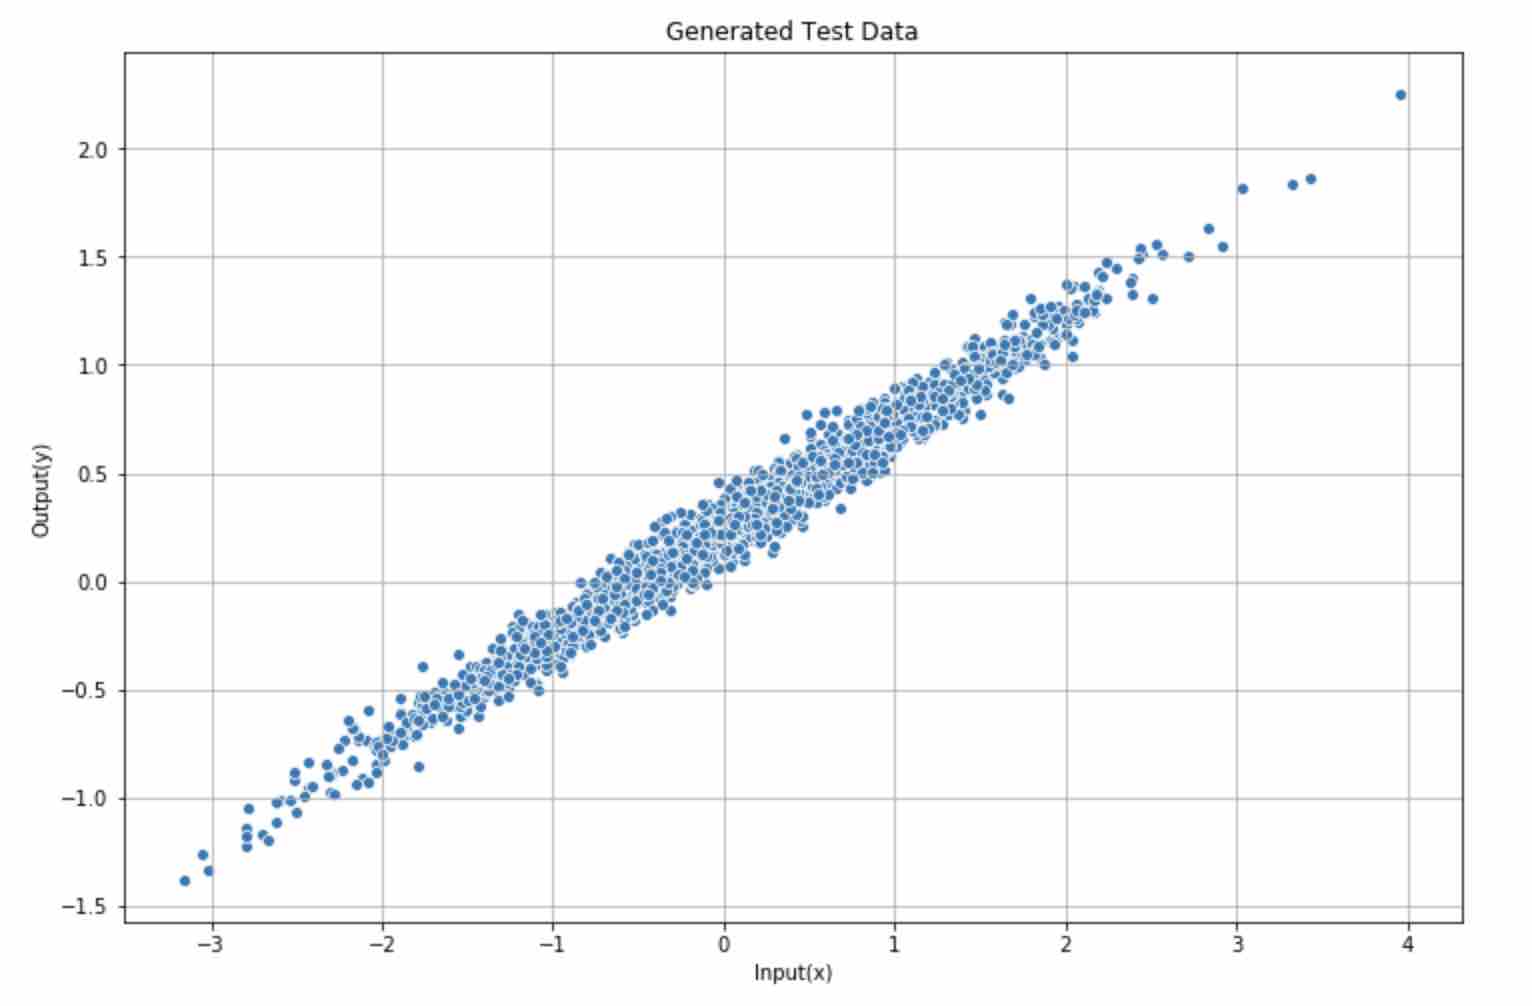
generated test data

Define linear regression model

1
2
3
4
5
6
7
8
9
10
11
12
13
14
15
16
17
18
19
20
21
22
23
24
25
26
27
28
29
30
31
32
33
34
35
36
37
38
39
40
41
42
class SimpleLinearRegression():
    def __init__(self):
        self.parameters = {}
        self.m = None

    def predict(self, x):
        self.m = np.shape(x)[0]
        try:
            y_pred = self.parameters['w']*x + self.parameters['b']
            return y_pred
        except KeyError:
            print('Fit your data first and then predict the value')

    def cost(self, y_pred, y):
        return (np.sum(np.square(y_pred - y))) / (2 * self.m)

    def fit(self, x, y, learning_rate=0.01, iterations=1000):
        self.parameters['w'] = np.random.randn()
        self.parameters['b'] = np.random.randn()
        cost = []
        # forward propagation to get cost
        y_pred = self.predict(x)
        cost.append(self.cost(y_pred,y))
        print('Cost at iteration 1 is: ', cost[0])

        for i in range(iterations):
            # backward propagation to update parameters
            dw = np.sum((y_pred - y) * x) / self.m
            db = np.sum(y_pred - y) / self.m

            self.parameters['w'] -= learning_rate * dw
            self.parameters['b'] -= learning_rate * db

            y_pred = self.predict(x)
            cost.append(self.cost(y_pred, y))
            if (i+1) % 100 == 0:
                print('Cost at iteration ' + str(i+1) + ' is: ', cost[i])
        plt.title('cost vs iteration')
        plt.plot(cost)
        plt.xlabel('NO. of iterations')
        plt.ylabel('cost')
        plt.show()

Run model

1
2
3
4
5
6
7
8
9
10
11
12
13
14
model = SimpleLinearRegression()
model.fit(x,y)

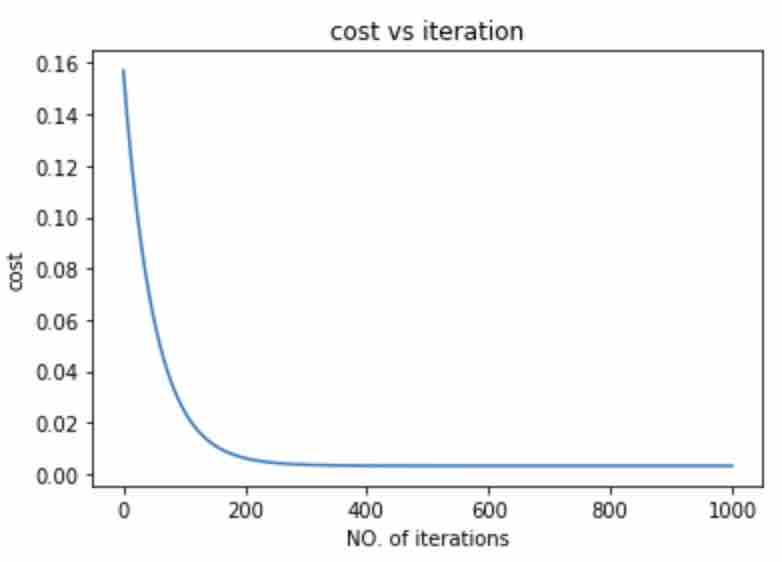
# Cost at iteration 1 is:  0.1570814686564645
# Cost at iteration 100 is:  0.024981536822118976
# Cost at iteration 200 is:  0.006183300770766369
# Cost at iteration 300 is:  0.0035637361005950675
# Cost at iteration 400 is:  0.003198036709326985
# Cost at iteration 500 is:  0.003146901238773841
# Cost at iteration 600 is:  0.003139740642835514
# Cost at iteration 700 is:  0.0031387366349620383
# Cost at iteration 800 is:  0.003138595698202284
# Cost at iteration 900 is:  0.0031385758941244986
# Cost at iteration 1000 is:  0.00313857310878851

cost_vs_iteration

1
2
3
model.parameters()

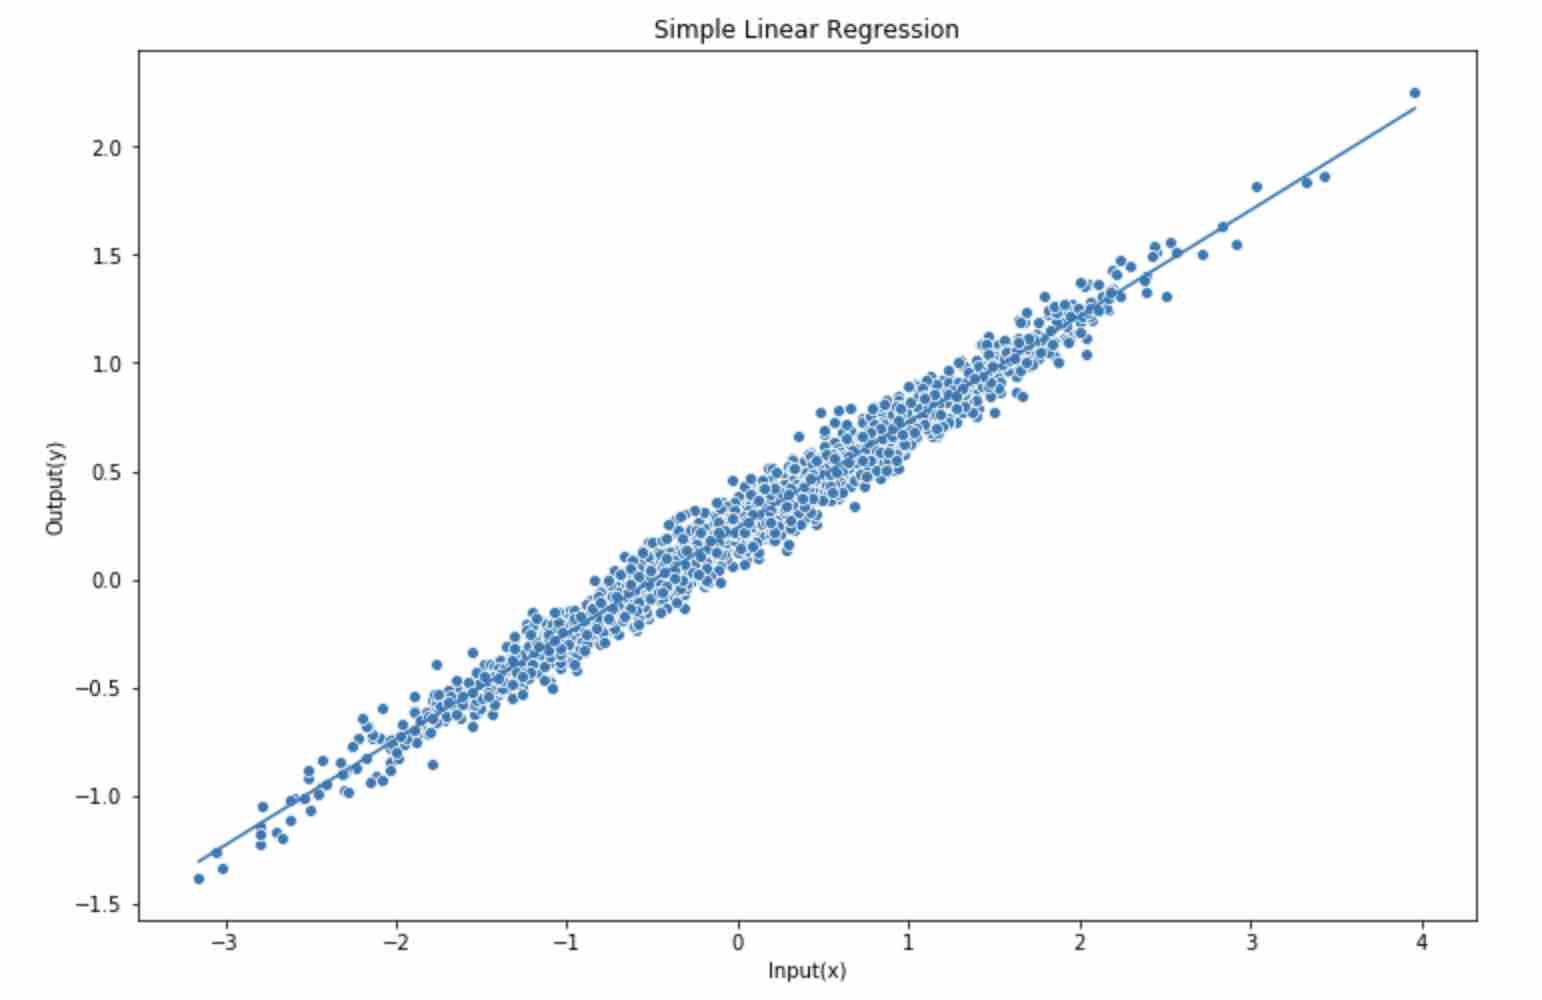
# {'w': 0.4899721769771579, 'b': 0.23803505464757935}

Plot predicted linear function

1
2
3
4
5
6
7
8
y_pred = model.predict(x)
plt.figure(figsize=(12,8))
plt.title('Simple Linear Regression')
sns.scatterplot(x=x[:,0],y=y[:,0])
sns.lineplot(x=x[:,0],y=y_pred[:,0])
plt.xlabel('Input(x)')
plt.ylabel('Output(y)')
plt.show()

prediction